Joseph R. Roberson
Instructional Systems Development, UMBC
May 13, 2014
Abstract
Learning Analytics is “the measurement, collection, analysis and reporting of data about learners and their contexts, for purposes of understanding and optimizing learning and the environments in which it occurs” (Siemens, 2011). Learner-Centric Learning Analytics are centered on the individual’s learning process: the learner is in the driver’s seat. Learner-Centric Learning Analytics is the measurement, collection, analysis and reporting of data about one’s own digital traces for the purpose of understanding and optimizing learning about one’s self as well as about the subject at hand. In Learner-Centric Learning Analytics, the learner views the analytics on a virtual dashboard (graphical user interface, or GUI) that provides navigational assistance along the Content Mastery Continuum while, simultaneously, providing navigational assistance along the Learning Mastery Continuum. Considered as a form of personal informatics, Learner-Centric Learning Analytics bears a natural affinity with the Quantified Self movement, described as “collecting traces that users leave behind and using those traces to improve their experiences” (Govaerts, Duval, Verbert, & Pardo, 2012). Examples are given of efforts pointing towards further research and potential future developments of Learner-Centric Learning Analytics.
Keywords: Educational Analytics, Learning Analytics, Learner-centric Learning Analytics, Formative Assessment, Personal Informatics, Quantified Self, Transformative Learning, Double-loop Learning, Assimilation, Heutagogy, Distance Education
Introduction
Analytics are used in higher education to address issues on three levels: the macro level (society and government), the meso level (institution, department), and the micro level (teachers and learners). This paper focuses on the micro level. The Horizon Report began citing Learning Analytics as an important emerging trend in the 2011 Higher Education issue. The purpose of Learning Analytics is “the measurement, collection, analysis and reporting of data about learners and their contexts, for purposes of understanding and optimizing learning and the environments in which it occurs.” This paper focuses on Learner-Centric Learning Analytics, described as those methods and practices that place the learner in the driver’s seat, where the analytics are displayed on a learner ‘dashboard,’ and are designed to help the student gain mastery, not only in the subject content at hand, but also–and more importantly– to help the learner gain mastery of learning.
Why is it important to master the learning process? In the past, it was not unreasonable to expect to work for one company, in essentially the same job, throughout one’s life. Retirement benefits were assured. Those days are gone. The company can no longer be depended on to provide a safe and secure home away from home. Employers can no longer be depended on to look after your best interests, like surrogate parents. Today, you’re on your own. To thrive in the new global economy you have to be adept at continuous, self-directed learning, because “…in the emerging workplace, most students—not just an elite few—must be able to find, synthesize, and evaluate information from a wide variety of subjects and sources” (Alliance For Excellent Education, 2012, p. 2). As the pace of technological progress accelerates, so does the volume of data, information, and knowledge. We must be increasingly nimble at navigating and responding to change, complexity, and chaos, in cyberspace and in the ‘real world.’ In addition, children (and adults) need to know how to protect themselves against predatory elements in cyberspace; e.g., those who deploy advanced analytics to influence and manipulate (Lewis, 2014).

Learning is the acquisition of knowledge through experience, study, or from being taught (Merriam-Webster). Learning is “the process by which experience or practice results in a relatively permanent change in behaviour or potential behaviour” (Jones, Learning to Learn – Seven Habits For Effective Learning, 2013). Learning is what you must do when you want to respond differently the next time you encounter a certain stimulus, condition, or situation. To achieve this learning objective, you must create, modify, or extinguish a specific pattern of behavior in at least one of these categories: patterns of cognitive behavior (thinking, knowing); patterns of affective behavior (emotion, mood, feeling); or patterns of psychomotor behavior (doing, acting).
Our ability to learn is what sets us apart and makes us Earth’s dominant species: learning is what moulds the feral child into a cultured citizen, in the same way a gardener shapes a tree into espalier. Learning is said to rely on the transfer of new information from perception to short-term and, most importantly, into long-term memory. If new content does not get encoded into long-term memory it is soon forgotten.
Habits are a special class of learning because they are encoded into a much older region of the brain, the basal ganglia. Like a computer’s ROM (Read-Only Memory), habits “can only be modified slowly or with difficulty” (Wikipedia). Even if lose your recall of memories entirely, habits can go on just as before (Duhigg, 2012). This accounts for why learning habits, altering habits, and extinguishing habits are challenging for many, if not most, people. Habits are tough to change because their patterns imprint deeply, sometimes permanently, into the very fabric of the nervous system. This is a good thing when it allows you to drive and carry on a conversation at the same time– and perhaps texting all the while, but not good if you’re trying to stop smoking.
Study habits can be regarded as a group of behavior patterns. In the Learning Mastery Continuum, the learner progresses from behavior patterns of dependency upon external agents to behavior patterns of independent agency. This model is divided into three stages: the instructor-dependent learner, emerging independent learner, and finally the self-regulated learner [Figure 1]. The self-regulated learner, by definition, exhibits healthy learning habits. Healthy learning habits are a hallmark of Heutagogy.
Analytics
The term analytics means “the method of logical analysis,” and has been in use at least as far back as 1581. Analysis is defined as “a careful study of something to learn about its parts, what they do, and how they are related to each other; an explanation of the nature and meaning of something.” The origin of analysis lies with analyein, Greek for “to break up” (Merriam-Webster). For our purposes, the most relevant definition of analytics is “the use of data, statistical analysis, and explanatory and predictive models to gain insights and act on complex issues“ (Bichsel, 2012). By this definition, analytics does not require a computer because analytics has been–and still can be–performed with nothing more technologically advanced than pencil and paper…plus some relatively simple computation skills. Navigating among the confusion of terms, definitions, technologies and applications of analytics can be confusing. We can simplify the task by categorizing among them by asking the four basic questions proposed by Chatti, Dyckhoff, Schroeder, & Thus (2012), plus a fifth that is of especial relevance to this paper:
- What data is collected?
- Who is the subject of inquiry?
- Why is this inquiry being conducted?
- How does the system perform the analysis?
- Who sees, interprets, and acts on the results?
Advanced analytics is computer-aided analysis of large databases of information recorded from many people’s electronic activities. Beyond simple number crunching, advanced analytics incorporates machine learning, advanced algorithms, neural networks, and artificial intelligence. I say computer-aided because a computer cannot analyze anything; at this point in history at least, only a human mind can construct explanation and meaning. What computers can do very well is to process huge databases at nearly the speed of light to discover repeating patterns within the data. The human designer steers the process towards patterns that are significant, relevant, and useful. Those patterns are of value that help answer five basic questions:
- What happened?
- Why did it happen?
- What is most likely to happen next?
- What intervention, during an event, is most likely to cause a desirable outcome?
- What pre-emptive actions or processes should be initiated to influence future outcomes?
Every type of analytics can inform future actions. However, advanced analytics provide the additional ability to intervene as events unfold. And what a goldmine that has turned out to be!
Advanced Analytics in Action (literature review)
How can advanced analytics predict what people will do next with startling accuracy? Because their behaviors display recurring, predictable patterns: humans are creatures of habit. Most of our daily thoughts, words, and actions are unconsciously controlled by automatic habit routines (Duhigg, 2012). While the data trails of each person are as unique as their fingerprints, there are, nonetheless, recurrent patterns, patterns that can be discovered through data analysis. Each person’s patterns are compared to the collection of previous individuals’ patterns stored in a database to identify matches between individuals and their other patterns of behavior. Matches between these patterns enable the program to generate predictions about future behavior. The examples that follow show how and why retailers, stock traders, police departments, the NSA, and many other organizations, employ predictive analytics.
Predictive analytics is about revealing unvolunteered truths about people. –Couts, 2103
Consumer profiling: In retail marketing departments, a pregnant woman is a gold mine. If you can identify and ‘capture’ a pregnant customer before any other retailer (and then keep her as a loyal customer) you stand to make a lot of money. In Predictive Analytics: The Power to Know Who Will Click, Buy, Lie or Die, Eric Siegel describes how Target developed the ability to ascertain who, among its customers, were pregnant even before she has voluntarily shared this information. Once identified, customized mailers and ads featuring baby products are sent to these new mothers-to-be. Target’s predictive analytics are so accurate that one man, the father of a teenaged daughter, accused Target of encouraging his daughter to become pregnant by sending these targeted ads, addressed to the teenager at their home address. The father later apologized: he had discovered what Target’s predictive analytics had, that “things have been going on I was not aware of.” Target knew more than the girl’s own father: she was, in fact, pregnant. (Siegel, 2013).
Churn Modeling: Cellular phone companies employ “churn modeling” to predict which customers are most likely to change carriers, and which can be convinced to stay if offered a better deal. Credit card companies decide who to offer higher credit limits to with predictive analytics. Hewlett Packard uses predictive analytics to identify “flight risks,” employees who are likely to quit.
The average investor…logs onto his TD Ameritrade or E*Trade or Schwab account, enters a ticker symbol of some stock, and clicks an icon that says Buy. Then what? He may think he knows what happens after he presses the key on his computer keyboard, but trust me, he does not. If he did, he’d think twice before he pressed it. -Lewis, 2014
Day traders take advantage of the exponential growth of computer processing speed, powerful algorithms, and ultra-fast fiber optic data transmission, to game the system. In that split second between the buyer’s click that sends a stock purchase order and its reception on the other end, lightning-fast software intercepts the order, buys those shares, and then instantly offers it back to the customer at a higher price (Lewis, 2014).
Dragnet: With what may well be the world’s biggest and fastest analytics system, NSA’s PRISM program scours domestic and international telephone calls, internet activity, and who knows what else, in search of data patterns indicating communication about terrorism (and who knows what else) (Couts, 2103).
Advanced Analytics in Education
In education, as in business and government, analytics help address issues on three levels: the macro level (academic analytics), the meso level (institution, department), and the micro level (learning analytics). This paper is concerned only with the micro level, with the use of Learning Analytics to impact learning activities in higher education. Due to the nonprofit, service-based nature of education, however, the design and use of analytics must be guided by appropriately different objectives; namely, those that privilege the consumer (student) over the company (school).
Learning analytics. The field of Learning Analytics brings together, in addition to the aforementioned disciplines of data mining, analytics, statistics, adult learning theory, instructional design, and teaching. Corporations and institutions began using LA for training, development, and performance improvement long before education: “Analytics in higher education is operating in a larger context: the emergence of so-called big data in virtually every industrial sector. While higher education lags other industries, we can learn much from the penetration and impact of big data in other sectors.” (Norris & Baer, 2013, p. 10). “Work done at California State University, Chico, Purdue Unicversoty, and the University of Georgia, among others, has shown that learning management system (LMS) activity data can be predictive of student success” (Fritz, Using Analytics at UMBC, 2013, p. 1)
Why do colleges and universities want to use learning analytics? The short answer is student (and institutional) success. In Leaving College: Rethinking the causes and cures of student attrition, Tinto suggests three necessary conditions for student persistence: first, put programs into place that place student welfare above the university’s; second, programs and solutions should be focused on all students at an institution, not just a specific subpopulation; third, enhance student success, and therefore persistence, with initiatives that help integrate a student academically into the institution (Tinto, 1993).
What data is collected in a typical LA system? The 2012 NMC Horizon Report’s list of collected data includes “explicit student actions, such as completing assignments and taking exams, and from tacit actions, including online social interactions, extracurricular activities, posts on discussion forums, and other activities that are not directly assessed as part of the student’s educational progress” (Johnson L. A., 2012, p. 26).
How is the data analyzed? In the case of Purdue University, an early adopter of learning analytics in higher education with a homegrown application called Course Signals, the process consists of
A predictive student success algorithm (SSA) is run on-demand by instructors. CS [Course Signals] works by mining data from multiple university sources and subsequently transforming the data into a generated risk level with supporting information for each student. The algorithm that predicts students’ risk statuses has four components: performance, measured by percentage of points earned in course to date; effort, as defined by interaction with Blackboard Vista, Purdue’s LMS, as compared to students’ peers; prior academic history, including academic preparation, high school GPA, and standardized test scores; and, student characteristics, such as residency, age, or credits attempted. Each component is weighted and pulled into the proprietary algorithm, which then calculates a result for each student.
(Arnold & Pistilli, 2012, p. 1)
Who views the LA data? Although accessed at the macro, meso, and micro levels, the primary viewers for our purposes are faculty and students. How is the data viewed? With Course Signals, a stop-light graphic [Figure 3] displayed within the student’s Blackboard LMS dashboard shows whether the analytics is predicting success in the course (green), potential failure (yellow), or high likelihood of failure (red). Instructors see all students’ status on an aggregate course dashboard [Figure 4]. Who is expected to act on the ‘intelligence’? It seems that the intention is to nudge the student to take responsibility, but (perhaps owing to the ambivalent nature of the student-teacher relationship at this age) faculty are still expected to play the role of surrogate parent and to intervene if necessary. If the student is deemed to be at-risk, the instructor can deploy several different interventions, including email messages, automated alerts, reminders, text messages, referral to an academic advisor or academic resource center, and face-to-face meetings.
What are the results? Purdue has achieved significant improvements in student performance with Course Signals; these include, in the Fall 2009 semester, an increase of 10.97% in the number of A or B final grades, plus a 6.41% decrease in those receiving a grade of D, F, or W (withdrawals). Not only have grades improved, retention has also increased (Arnold & Pistilli, 2012, p.2).
At roughly the same time, UMBC developed and deployed Check My Activity (CMA), another dashboard add-on for Blackboard [Figures 5 & 6]. Teacher and student can view learning activity data recorded by the LMS. While other organizations chase the elusive ideal of the predictive system, CMA employs modest analytics (Rogers, Colvin, & Chiera, 2014). A simple correlation between the student’s amount of activity and final grade in any given course is a reliable predictor of success, reliable enough to trigger intervention with students identified as being at risk of failing. The school discovered that “students earning a final grade of D or F have used Bb about 40% less than students earning a C or higher” (Fritz, Using Analytics at UMBC, 2013). Interventions include alerts to the student from the Learning Resource Center, providing a list of a dozen or so “help resources” (Fritz, Using Analytics at UMBC, 2013).
Learner-centric learning analytics: There is a stark contrast between the use of analytics in retail and stock trading, where the goal is to gain advantage over the consumer (Siegel, 2013), and the use of analytics in education, where the goal is the give advantage to the consumer (the student). Likewise, there is a contrast, albeit less stark, between LMS-based Learning Analytics and Learner-centric Learning Analytics, especially those developed for the Web 2.0 environment. While many, if not most, higher education LA applications make efforts to nudge the student to take responsibility for their own success, that does not make them learner-centric.
Learning Management Systems are evolving rapidly and now have the capacity to adjust every few minutes in order to maximize learner success. On one hand, this is fantastic, because it has the potential to increase learning exponentially and help to solve the national and international crisis in public education. On the other hand, as Erik Duval asserts, this is dangerous. He goes so far as to say that the LMS should be banned, because:
We can build [LMS] systems that will automatically guide you as a student and will tell you every 10 or 15 minutes what you should do. These systems work–if you have large numbers of students–very well. My claim is they’re better than the average teacher; not as good, they’re better. But they’re also dangerous, in my view, because if you teach students that way they will graduate–and I think we can make them graduate in three years rather than five years as we do now for a master’s degree–and I think I can reach the same level with those students. But the problem is those students who get out of university will be used to a piece of software telling them every 15 minutes “you should do this, and now you need to do that,” and while the software is doing it [extremely well] it isn’t giving students the things that we typically talk about as 21st century skills. It isn’t teaching them how to be creative, how to be communicative, collaborative– all the ’C’ skills. -Duval, 2013

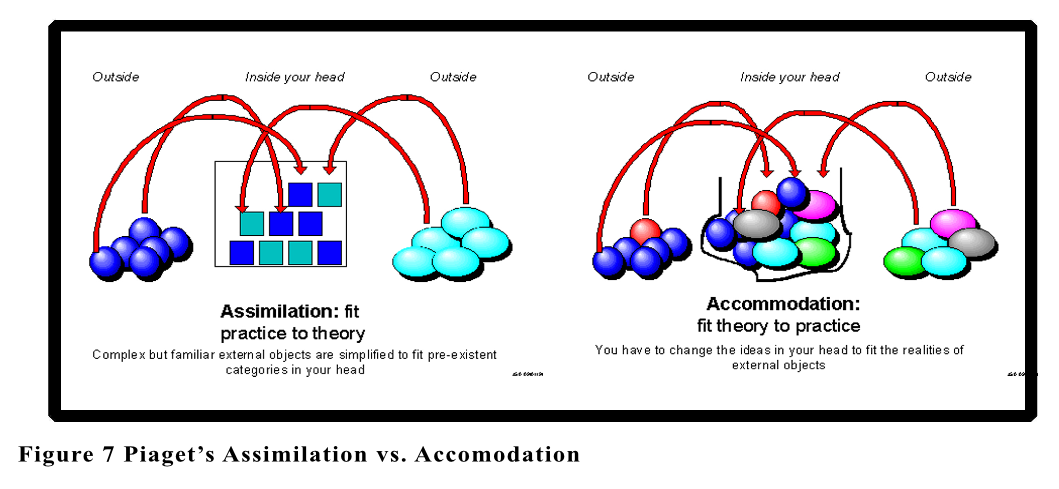
Learner-Centric Learning Analytics is the subset of Learning Analytics that places the learner squarely in the driver’s seat, rather than teacher or school. LCLA is designed to increase not only mastery of course content but mastery of the learning process as well. Learner-Centric Learning Analytics has its theoretical basis in the Developmental Curriculum model, which follows the natural maturation of teaching and learning from Pedagogy (dependent learner) to Andragogy (semi-independent learner), and ultimately to Heutagogy (independent learner). Mastering the learning process, along the PAH arc, develops qualities of self-determination, discipline, autonomy, and self-direction (Blaschke, 2012). Most existing learning analytics applications manifest top-down pedagogy, and thus does not align with the ideals of Andragogy, much less with Heutagogy. To be aligned it must manifest a bottom up model, one that integrates Piaget’s accommodation as well as assimilation [Figure 7], Argyris and Schon’s double-loop learning [Figure 8], and what Landmark Education calls Transformative Learning: Unlike informative learning, which increases what people know and adds to their skills by bringing new knowledge to an existing worldview and frame of reference, transformative learning gives people an awareness of the basic structures in which they know, think, and act (Landmark Education). [Figure 9]

Learning progress within any subject area can be mapped from dependent novice to independent master along the content mastery continuum [Figure 2]. Progress in mastering the learning process itself can likewise be plotted onto a learning mastery continuum. Learner-centric Learning Analytics is designed to increase not only mastery of course content but also– and more importantly– mastery of the learning process itself. Progress in any area of learning content, from incompetence to competence and ultimately to mastery of the subject, can be mapped onto a Content Mastery Continuum; progress in learning skills can be mapped likewise, from Pedagogy to Andragogy, and ultimately to Heutagogy (PAH). Mastering the learning process involves assuming 100% responsibility for learning; the process of mastering learning develops qualities associated with Heutagogy- self-determination, discipline, autonomy, and self-direction (Blaschke, 2012). When the learner to take responsibility for his own learning process: Students regulate their own learning process, making themselves choices on how intensively they will exercise and therefore, are the ones who need to become convinced of the usefulness of these digital tools. In this, learning analytics can play an important role: it provides a multitude of information that the student can use to adapt the personal learning environment as much as possible to their own strengths and weaknesses (Tempelaar, 2013, p. 205).

Apotheosis or Technocalypse?
Artificial Intelligence is an important part of advanced analytics. Some futurists claim AI will help humans transcend biology to become veritable gods. Other futurists are convinced AI will be responsible for the extinction of the human species (Theys, 2006). The question is not whether it will have great impact, for consensus opinion says it will, but whether it will deify the human race or destroy it. Ray Kurzweil predicts that what he terms the Singularity, wherein AI achieves decisive superiority over its creators, will occur around the year 2045 (Kurzweil, 2005). Current debate pits those who say that AI will eliminate the human race against those who say it will enable the individual to become god-like, with powers unimaginable today. While the desirability of possessing superhuman powers may be debatable, there should be no debate about the undesirability of our extinction. And if this sounds to you like fear-mongering, merely the shrill cries of dystopian naysayers and conspiracy theorists (as it did to me), perhaps Stephen J. Hawking’s warning will convince you otherwise. In a recent article for The Independent, the world-renowned physicist amplified the alarm: Whereas the short-term impact of AI depends on who controls it, the long-term impact depends on whether it can be controlled at all (Hawking, 2014).
Whereas the short-term impact of AI depends on who controls it, the long-term impact depends on whether it can be controlled at all.
Quantified Self and Learner-Centric Learning Analytics: As I sit typing this paper, I glance occasionally at my watch to check my pulse. Besides pulse, the Basis Band tracks my steps, calories burned, miles traveled, exertion level, and my sleep [Figures 10, 11, 12]. A different sensor, clipped to my earlobe, measures my heart rate variability and feeds the data into the emWave Pro, a HeartMath application; the dashboard display coaches me to synchronize my breathing with my pulse while generating a calm and positive emotional state [Figure 13]. Other moments I look up at the second monitor to check my concentration. I’m wearing a MindWave Mobile headset that measures my brainwave EEG and displays it in colorful, ever-changing patterns [Figure 14]. Some days I check my blood pressure with a standard cuff, because I haven’t yet bought the Withings version that sends the readings directly to my iPhone or iPad or MacBook. I’m looking forward to purchasing the Apple iWatch whenever it is available, so I can do all of this directly through it, instead of needing several different devices.
I am an unofficial member of the Quantified Self movement, a bunch of people passionate about using this kind of data monitoring to improve the functioning of body and mind. The devices provide me with personal informatics which “help users to improve self-knowledge by providing tools for the review and analysis of their personal history. Self-knowledge has many benefits, such as fostering insight, increasing self-control and promoting positive behavior ” (Verbert & Duval, 2013, p.2) [Figure 15]. Timothy Harfield waxes rhapsodic about the potential benefits of a marriage of wearable sensors and learning analytics:
Personal activity monitors like the [JawBone] UP should be exciting to–and closely examined by–educators. As a wearable technology that entices users to self-improvement by making performance analytics into a game, the UP does exactly what we are trying to do in the form of student activity dashboards, but doing it better. In this, the UP app should serve as an exemplar as we look forward to the development of reporting tools that are user-focused, promoting ease, access, and fun.
Looking ahead, however, what is even more exciting (to me at least) is the prospect that wearable devices like the UP might provide students with the ability to extend the kinds of data that we typically (and most easily) correlate with student success. We have LMS information, and more elaborate analytics programs are making effective use of more dispositional factors. Using the UP as a platform, I would like to see someone develop an app that draws upon the motion, mood, and nutrition tracking power of the UP and that allows students to relate this information to academic performance and study habits. Not only would such an application give students (I would hesitate to give personal data like this to instructors and / or administrators) a more holistic vision of the factors contributing or detracting from academic success, but it would also help to cultivate healthy habits that would contribute to student success in a way that extends beyond the walls of the university and into long-term relationships at work, to family, and with friends as well (Harfield, 2013).
Conclusions and Future Study
The imperative exists to equip our children with the tools that will be required if we are to see a future enhanced by the positive potential of artificial intelligence, as with each of the myriad technological advances afoot. One way to help our children equip themselves for the future is through Learner-Centric Learning Analytics. Learner-Centric Learning Analytics represents the way forward in Erik Duval’s (and my) view. Learning analytics should be used to help the student mature along the Content Mastery Continuum. Teaching methods should likewise progress from Pedagogy, for children, through Andragogy, for teens and young adults, and finally to Heutagogy, to help the individual development into a self-regulated learner. I imagine learning analytics that includes biofeedback data to generate a better picture of the learner learning. Erik Duval proposes research experiments where a learner’s clicks are recorded by the LMS and, at the same time, their vital signs are recorded by activity trackers, EEG monitors, and the like (Duval, 2013). This real-time feedback loop might even include depictions of the changes occurring within the brain, the shifting of synaptic connections into new patterns– what we call learning. This could be a fascinating, and potentially significant, area of research.
I hope to be granted permission to conduct a modest action research project this Fall for my Applied Research Design course (EDUC771T) at UMBC. First year students identified as being at risk of poor performance, failing courses, or dropping out would be taught stress management and concentration techniques (breathing, yoga, meditation). Personal informatics (vital signs) would be monitored by an activity tracker device such as the FitBit Force, Jawbone UP24, Basis Band, or HeartMath Inner Balance. Course metrics, captured by the Check My Activity widget, would provide quantitative evidence to prove or disprove the benefit of this intervention. My prediction is that this combination of personal informatics, self-regulation techniques, and course activity monitoring, would contribute to increased learning, higher grades, and greater student persistence.
References
-Aljohani, N. R., & Davis, H. C. (2013). Learning Analytics and Formative Assessment to Provide Immediate Detailed Feedback Using a Student Centered Mobile Dashboard. Seventh International Conference on Next Generation Mobile Apps, Services and Technologies (pp. 262-267). CPS.
-Assimilation and Accommodation. (n.d.). Retrieved April 17, 2014, from Learning and Teaching: http://www.learningandteaching.info/learning/assimacc.htm
-Attri, A. K. (3013). Significance of Heutagogy in Distance Education. Scholarly Research Journal for Interdisciplinary Studies, 458-464.
-Bichsel, J. (2012, August). Analytics in Higher Education Benefits, Barriers, Progress, and Recommendations. Retrieved April 6, 2014, from Educause: http://net.educause.edu/ir/library/pdf/ERS1207/ers1207.pdf
-Blaschke, L. M. (2012, January ). Heutagogy and Lifelong Learning: A Review of Heutagogical Practice and Self-Determined Learning. Retrieved April 14, 2014, from International Review of Research in Open and Distance Learning: http://www.irrodl.org/index.php/irrodl/article/download/1076/2113
-Buckingham, S., & Gašević, D. &. (2012). Proceedings of 2nd International Conference on Learning Analytics and Knowledge. NY: ACM.
-Couts, A. (2103, August 13). What’s the NSA picking out of your phone calls? Just ‘unvolunteered truths’ . Retrieved April 19, 2014, from Digital Trends: http://www.digitaltrends.com/mobile/whats-the-nsa-picking-out-of-your-phone-calls-just-unvolunteered-truths/#!EVHft
-Garrison, D.R. & Baynton, Myra. (1987). Beyond Independence in Distance Education: The Concept of Control. The American Journal of Distance Education. 7-15.
-Duhigg, C. (2012). The Power of Habit: Why We Do What We Do in Life and Business. NY: Random House.
-Duval, Eric (2013, June 13). Open Learning Analytics: Erik Duval at TEDxUHowest. Retrieved April 19, 2014, from YouTube: https://www.youtube.com/watch?v=LfXDzpTnvqY
-Elias, T. (2011). Learner Analytics: Definitions, Processes and Potential. Retrieved April 1, 2014, from Learning Analytics: http://learninganalytics.net/LearningAnalyticsDefinitionsProcessesPotential.pdf
-Fritz, J. (2014, April 8). Asst. VP, Instructional Technology @ UMBC. (J. Roberson, Interviewer)
-Fritz, J. (2013, April 30). Using Analytics at UMBC. Retrieved March 28, 2014, from Science Direct: http://www.sciencedirect.com/science/article/pii/S109675161000062X
-Fritz, J. (2013, April 30). Using Analytics at UMBC: Encouraging Student Responsibility and Identifying Effective Course Designs. Retrieved March 24, 2014, from EDUCAUSE: Center for Applied Research: http://www.educause.edu/library/resources/using-analytics-umbc-encouraging-student-responsibility-and-identifying-effective-course-designs
-Johnson, L. S. (2011). The Horizon Report 2010. EDUCAUSE Learning Initiative. Austin: The New Media Consortium.
-Landmark Education. (n.d.). Transformative Learning: Landmark’s Breakthrough Technology . Retrieved April 17, 2014, from Landmark Worldwide: http://www.landmarkworldwide.com/why-landmark/breakthrough-methodology
-Lewis, M. (2014). Flash Boys: A Wall Street Revolt. New York: W. W. Norton.
-Merriam-Webster Dictionary. (n.d.). Retrieved April 5, 2014, from Merriam Webster Dictionary: http://www.merriam-webster.com
-Moore, Michael. G. (1972). Learner Autonomy: the second dimension of independent learning. Retrieved April 14, 2014, from ERIC: http://eric.ed.gov/?id=EJ064957
-Piaget’s Stages of Cognitive Development: Background and Key Concepts of Piaget’s Theory . (n.d.). Retrieved April 17, 2014, from http://psychology.about.com/od/piagetstheory/a/keyconcepts.htm
-Roberson, Joseph (2013, May 12). Biosensor Devices: Technology, User Interface, Social Media. Baltimore, MD, USA: http://josephrroberson.files.wordpress.com/2013/10/finalconsumer-biosensor-devices.pdf.
-Siegel, Eric (2013). Predictive Analytics: The Power to Know Who Will Click, Buy, Lie, or Die. ?: Wiley.
-Siemens, G. (2011, September 12). Penetrating the Fog: Analytics in Learning and Education. Retrieved April 14, 2014, from www.educause.edu: http://www.educause.edu/ero/article/penetrating-fog-analytics-learning-and-education
-Tempelaar, D. T. (2013). Formative Assessment and Learning Analytics. LAK ’13 (pp. 205-209). Leuven: LAK ’13.
-Thomas M. Duffy, J. R. (2004). Learner-Centered Theory and Practice in Distance Education. (J. R. Thomas M. Duffy, Ed.) Mahwah, New Jersey: Lawrence Erlbaum Associates.
-Rogers, Tim & Colvin, Cassandra & Chiera, Belinda (2014). Modest Analytics: using the index method to identify students at risk of failure. LAK ’14. Indianapolis: Society for Learning Analytics Research.
-van Barneveld, A., Arnold, K. E., & Campbell, J. P. (2012). Analytics in Higher Education: Establishing a Common Language. Retrieved April 6, 2014, from Educause Learning Initiative: http://net.educause.edu/ir/library/pdf/ELI3026.pdf
-Verbert, K., & Duval, E. a. (2013, February 28). Learning Analytics dashboard applications. Retrieved April 18, 2014, from Sage Journals: http://abs.sagepub.com/content/57/10/1500.full.pdf+html?hwshib2=authn%3A1397920154%3A20140418%253A14ae5b9d-5103-4f9d-8b45-cc1a67715432%3A0%3A0%3A0%3AieE5ex%2F2nUcbPtdSOTdUJA%3D%3D
-What is a Schema? (n.d.). Retrieved April 17, 2014, from About.com/Education/Psychology: http://psychology.about.com/od/sindex/g/def_schema.htm
Additional Figures